

Visualizing Affordability Through Brooklyn’s MTA Reduced-Fare Ticket Data
OVERVIEW
Growing up as a native New Yorker, the subway has always been part of my routine. With over 3.6 million daily MTA riders, understanding who they are and how they use the system can yield important insights to improve service operations and accessibility.
This project began with a simple question: Can a rider’s ticket type tell us more about their experience and accessibility within the subway system?
From this question, we developed a data visualization that maps and compares subway fare types across Brooklyn’s neighborhoods, uncovering patterns that may indicate disparities or opportunities in how Brooklynites move through their city.
How might we ...
DISCOVER
It turns out, big cities like NYC have tons of open-source data available. So to build this visualization, I combined three different datasets.

DEFINE
Given the millions of daily NYC subway riders, running our algorithm on yearly ridership data across all boroughs would have exceeded our system’s capacity, as our MacBook Airs couldn’t handle that scale of computation. Therefore, we narrowed our focus to a subset of the data: Brooklyn’s ridership in October 2024.
Analyzing Brooklyn’s October 2024 ridership data provided a manageable starting point for uncovering broader NYC transit trends
You might wonder why we chose Brooklyn, October 2024. October has the highest ridership and fewer holidays, providing a more consistent dataset. Additionally, as a native Brooklynite, I’m personally interested in understanding my borough. That said, focusing on this subset does introduce bias. Brooklyn doesn’t represent all of New York City, and October isn’t reflective of year-round trends.
1
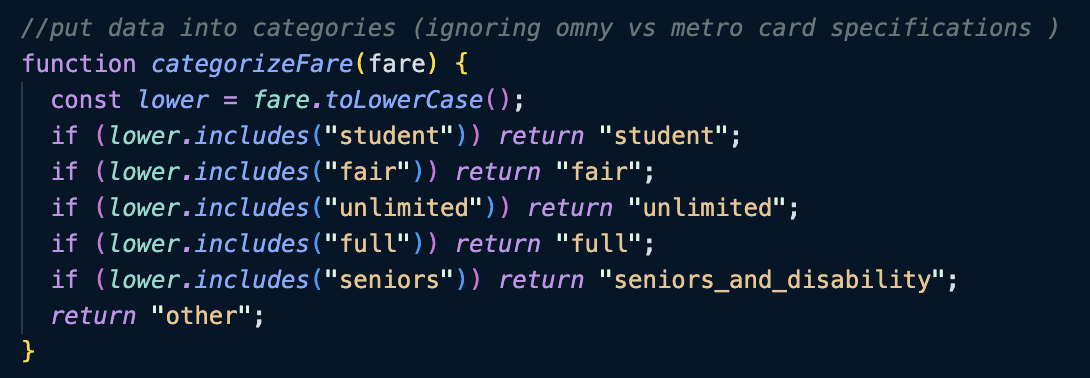
Ignored the distinction between OMNY and MTA tickets; a technology shift, not a behavioral one, so it offered no useful signal for this analysis.
2
Grouped 7-day and 30-day unlimited tickets under a single "unlimited" category to reduce complexity and focus on the most relevant patterns.
🏷️
FARE CATEGORIES
DESIGN

👀 To enhance the readability of the dashboard, I’ve:
Highlighted selections on hover
Guides user attention and improves interactivity, helping users explore the data
Directs focus to the key dataset, making the main story immediately clear

Makes comparisons easier and more intuitive for the viewer
DELIVER
Visualize which neighborhoods rely most on reduced transit fares, highlighting patterns in affordability and accessibility across the borough
Ticket type shows which fare categories, such as Fair Fares, Senior/Disability, or Student, are most commonly used to help identify rider preferences and patterns
NEXT STEPS
🗺️
EXPAND
Since my laptop couldn't handle large datasets, I focused on in on a subset. In the future, I want to expand the visualization to include all five boroughs and subway lines to compare yearly trends across NYC neighborhoods.
🔍
FILTER
To provide a cleaner visualization, I plan to add filters for year, ZIP code, and station, giving users the ability to slice the data and surface the stories most relevant to them.
📊
COMPARE
Compare discount fare data with demographic and income data to uncover broader patterns and insights about how transit affordability intersects with neighborhood identity across Brooklyn.
REFLECT
As my final official UT project, this felt like a full-circle moment. Growing up in NYC and riding the subway inspired me to pursue Urban Technology at the University of Michigan, and for this project, I wanted to explore the very subject that sparked that 4 year journey.
Looking at the data visualization, we can observe a gradual gradient from North Brooklyn to South Brooklyn, with more discounted fare riders concentrated in the southern areas. While we can’t make definitive assumptions about residents’ demographics, the data suggests that lower-income or family-oriented populations, reflected in student and senior tickets, may be more prevalent in southern Brooklyn. To confirm these patterns, further analysis incorporating detailed income data by zip code would be necessary.